PySpark Data Quality on Databricks with DQX.
A Deep Dive into Databricks Labs’ DQX: The Data Quality Game Changer for PySpark DataFrames
Recently, a LinkedIn announcement caught my eye—and honestly, it had me on the edge of my seat. Databricks Labs has unveiled DQX, a Python-based Data Quality framework explicitly designed for PySpark DataFrames.
Finally, a Dedicated Data Quality Tool for PySpark
Data Quality has always been a cyclical topic in the data community. Despite its importance, it’s been hampered by a lack of simple, open-source tools. Yes, we have options like Soda Core and Great Expectations, but they can be cumbersome to integrate. Enter DQX.
Here’s the official word from Databricks Labs:
“We’re thrilled to announce the release of DQX, Databricks’ new Python-based Data Quality framework designed for validating the quality of PySpark DataFrames. DQX is your go-to tool for proactive data validation, ensuring bad data never enters the system. Whether you’re working with batch or streaming pipelines, DQX helps maintain the integrity and reliability of your data.”
Why Data Quality Often Misses the Mark
The data engineering community has been slow to embrace Data Quality tools, primarily because most existing solutions are overly complex. Tools like pydeequ and Great Expectations often require significant setup and maintenance effort. As I always say:
“If the tool helping you is more complicated than the problem it’s solving, adoption will always be low.”
With DQX, Databricks Labs promises something different: simplicity, elegance, and seamless integration with PySpark. But does it deliver? Let’s dive in.
Key Features of DQX
From the GitHub documentation, here’s what DQX brings to the table:
- Quarantine invalid data: Ensures bad data never reaches the output.
- Batch and streaming support: Works seamlessly with Spark Batch and Delta Live Tables (DLT).
- Custom reactions to failed checks: Options include dropping, marking, or quarantining invalid rows.
- Check levels: Define warnings or errors based on the severity of issues.
- Row and column-level quality rules: Granular control for specific data checks.
- Profiling and rule generation: Automatically generate data quality rules based on profiling.
- Code or config-based definitions: Flexibility to define checks as Python code or YAML configurations.
- Validation summaries and dashboards: Easily track and identify data quality issues.
While many of these features align with standard expectations for Data Quality tools, the addition of a built-in Data Quality Dashboard stands out.
Getting Started with DQX
To test DQX, I decided to keep it simple. Instead of a full Workspace install, I used pip to add DQX to a Databricks Notebook. This approach allowed me to treat DQX like any other standalone Data Quality tool, similar to Great Expectations or Soda Core.
High-Level Workflow
Here’s how DQX works in practice:
- Data profiling: Automatically generate quality rule candidates with statistics.
- Define checks: Use code or configuration files to specify additional validations.
- Set criticality levels: Quarantine or mark invalid data based on severity.
- Batch and streaming support: Use DQX with your Spark pipelines.
- Dashboarding: Visualize data quality issues with minimal effort.
Hands-On with DQX
For testing, I used the open-source Divvy Bike Trip dataset. Here’s a quick walkthrough of my experience:
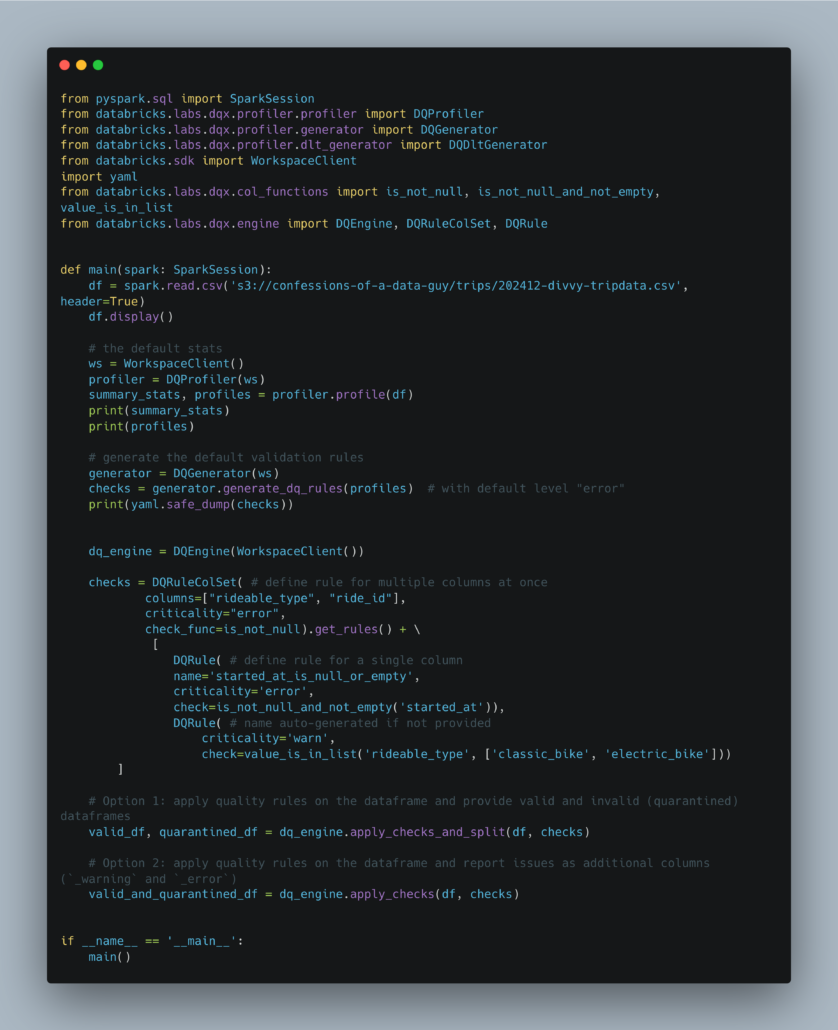
- Load the data: A few lines of code was all it took to load a DataFrame and generate basic statistics.
- Generate profiles: DQX produced a detailed profile of the dataset, which included recommendations for default validation checks.
- Validation checks: These ranged from ensuring columns were non-null to verifying that values fell within a predefined list. For instance:
- check:
    arguments:
      col_name: _c0
    function: is_not_null
  criticality: error
  name: _c0_is_null
- Custom checks: You can define your own rules in YAML or directly in Python. For example, I created a check to ensure a column’s values ended with
_bike:
import pyspark.sql.functions as F
from databricks.labs.dqx.col_functions import make_condition

def ends_with_bike(col_name: str):
    column = F.col(col_name)
    return make_condition(column.endswith("_bike"), f"Column {col_name} ends with _bike", f"{col_name}_ends_with_bike")
Advanced Features
Perhaps the most exciting feature is the ability to define Data Quality checks using SQL. For example, to ensure ride end times occur after start times:
- criticality: "error"
  check:
    function: "sql_expression"
    arguments:
      expression: "ended_at > started_at"
      msg: "ended_at is greater than started_at"
Here is an example of and end to end DQ pipeline.
Checkout my GitHub repo for complete code setup.

Final Thoughts
DQX feels like a breath of fresh air. It’s intuitive, powerful, and—most importantly—seamlessly integrated with PySpark. Whether you’re managing a massive Lake House architecture or just getting started with Data Quality, DQX offers a flexible and robust solution.
Databricks has clearly put thought into making DQX accessible and impactful. While there’s room for improvement—especially in areas like cost transparency for the Dashboard—the potential is enormous.
If you’ve been hesitant to tackle Data Quality in your pipelines, DQX might be the tool that changes your mind. I’m excited to explore it further and see how it evolves.
Stay tuned for more hands-on testing and insights!


