“Don’t mess with the dials,” they said. Spark (PySpark) Shuffle Partition Configuration and Performance.

Sometimes I amaze myself. I’ve been using PySpark for a few years now, happily crunching hundreds of TBs of data without much problem. Sure you randomly run into OOM errors and other such nonsense. Usually inspecting the code for something silly, throwing in a persist() or cache() here and there will solve 99% of the problems. I’ve always approached Spark performance with an overly pragmatic approach. Spark being the beast that it is, it’s easy to hide performance problems with more resources etc. I’ve generally tried to stay away from UDF's just using good coding practices and out of the box functionality. Ensuring good predicate pushdown’s, data partitioning etc are all helpful and important. But in the end… I don’t really know much about the out-of-the-box Spark configurations and how they affect performance.
Do the configurations change based on data size and partitioning strategy plus resources and cluster size? Probably. Does that seem complicated to figure out? Yes. Is the internet full of conflicting, vague and confusing advice? Of course.
Shuffle is something you hear about a lot when working with Spark. I’ve read most of the book Spark – The Definitive Guide … apparently I haven’t got to that chapter yet.
What is shuffle in Spark? Imagine you have a large dataset loaded in a Spark program on some cluster, you run some piece of code that requires certain pieces of data be related to other pieces of data, say like a groupBY. Now all of the sudden those pieces of data of have to be shuffled around the cluster so the work can be done correctly.
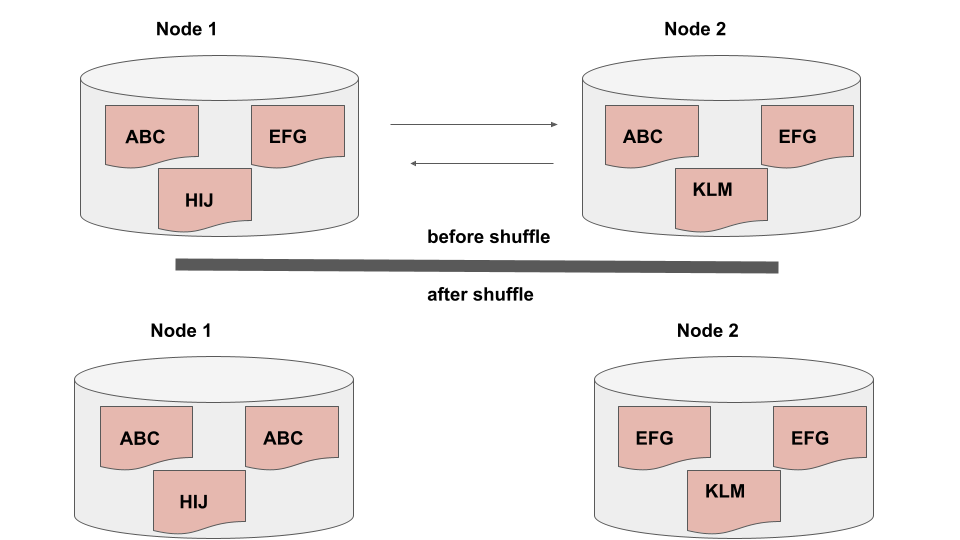
Basically, in the picture above you have ABC and EFG on different nodes in your Spark cluster. The shuffle happens when you call some action that needs to relate those two pieces of data, like in a groupBy and Spark must move that data around. Sounds hard and expensive? It is.
This about this, how is shuffle going to affect the performance of some intensive PySpark pipeline?
Well, it probably depends how the data set is stored and partitioned on disk. It also probably matters how much data there is to shuffle. Of course it’s going to be affected by the resources (CPU, RAM, number of machines) are available in the Spark cluster as well.
spark.sql.shuffle.partitions
One of the first configurations you might come across when troubleshooting or learning spark is spark.sql.shuffle.partitions . It has a default value of 200 and according to the docs….
“Configures the number of partitions to use when shuffling data for joins or aggregations.”
Spark performance tuning docs.
What should I set spark.sql.shuffle.partitions too?
How should I know? I don’t know your data size, resources available. And you don’t know mine.
If you search the depths of the interwebs you will generally find this advice?
“… with less or small data you should reduce the number of partitions, the more data you have the more shuffle partitions you might need….”
people on the internet
This is helpful but also very unhelpful at the same time. Mostly because this doesn’t take into account the resources available, and no where will you find what big and small data mean in actual data sizes.
Testing the performance while tuning spark.sql.shuffle.partitions
This is going to be a little tongue and cheek. Why? Because who know’s what the correlation is between Spark cluster size, data size, data partitions, and number of shuffle partition settings.
The goal here is to hopefully start to shed light onto some general patterns of performance using our own data set and machine, and playing around, to see what we can learn in general about the configuration of spark.sql.shuffle.partitions.
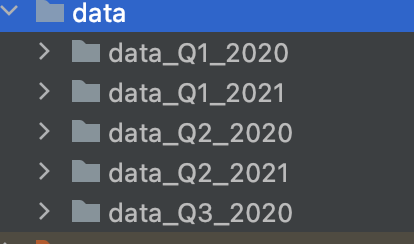
We will be using the open source Blackblaze Hard Drive stats, I downloaded a little of 20GB or data, about 69 million rows, a small data set, but probably enough to play around with and get some answers.
We are going to test this two ways.
- single machine (8 cores, 16 GB)
- 3 node Spark cluster.
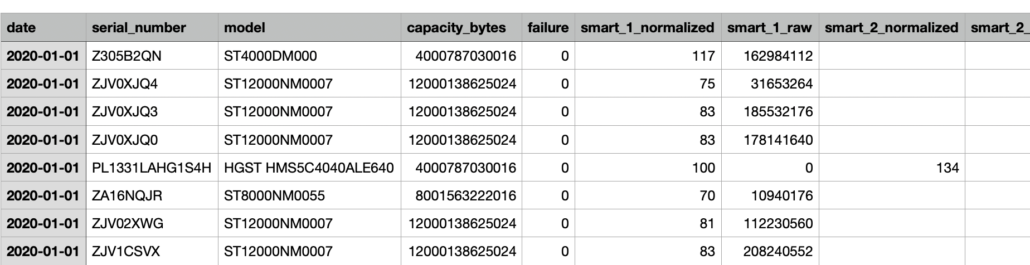
The data looks like the following …
Basically what I’m going to do is write a simple Spark script that is going to groupBy the date of the dataset and count the number of hard drive failures. Basically charting hard drive failure rate over time.
Here is the code we will be running. It’s available on GitHub.
from pyspark.sql import SparkSession, DataFrame, Window
import pyspark.sql.functions as F
from datetime import datetime


def read_hard_drive_data(spark: SparkSession, data_location: str = 'data/*/*.csv') -> DataFrame:
    df = spark.read.csv(data_location, header='true')
    return df


def format_data(df: DataFrame) -> DataFrame:
    out_df = df.withColumn("date", F.to_date('date', 'yyyy-MM-dd'))
    return out_df


def calculate_failure_rates(df: DataFrame) -> DataFrame:
    metrics = df.groupBy('date').agg(F.sum(F.col('failure')).alias('failure_rate'))
    return metrics


def main():
    spark = SparkSession.builder.appName('HardDriveFailures') \
        .getOrCreate()
    t1 = datetime.now()
    df = read_hard_drive_data(spark=spark)
    df = format_data(df)
    metrics = calculate_failure_rates(df)
    metrics.write.parquet('metrics', mode='overwrite')
    t2 = datetime.now()
    metrics.show()
    print("it took {x}".format(x=t2-t1))
    df.show()


# Press the green button in the gutter to run the script.
if __name__ == '__main__':
    main()
Here are the results on the single machine (8 core, 16 GB) with default 200 Testing the performance while tuning spark.sql.shuffle.partitions
+----------+------------+
|      date|failure_rate|
+----------+------------+
|2021-06-22|         2.0|
|2021-01-27|         1.0|
|2020-08-24|         6.0|
|2020-08-05|         8.0|
|2020-07-24|         3.0|
|2020-01-21|         4.0|
|2020-08-28|         1.0|
|2020-08-29|         4.0|
|2020-04-30|         1.0|
|2021-05-12|         7.0|
|2021-04-29|         5.0|
|2020-09-24|         5.0|
|2020-03-13|         2.0|
|2020-03-07|         0.0|
|2021-04-24|         2.0|
|2020-02-15|         6.0|
|2020-02-04|         9.0|
|2021-02-15|         7.0|
|2020-05-23|         2.0|
|2021-05-03|         4.0|
+----------+------------+
only showing top 20 rows

it took 0:01:15.688602
Small data? Let’s cut the Testing the performance while tuning spark.sql.shuffle.partitions in half to 100 and see what happens.
--conf spark.sql.shuffle.partitions=100Well, it got slower!
it took 0:01:20.821072What about if we go up this time? Set spark.sql.shuffle.partitions to 300?
it took 0:01:19.041218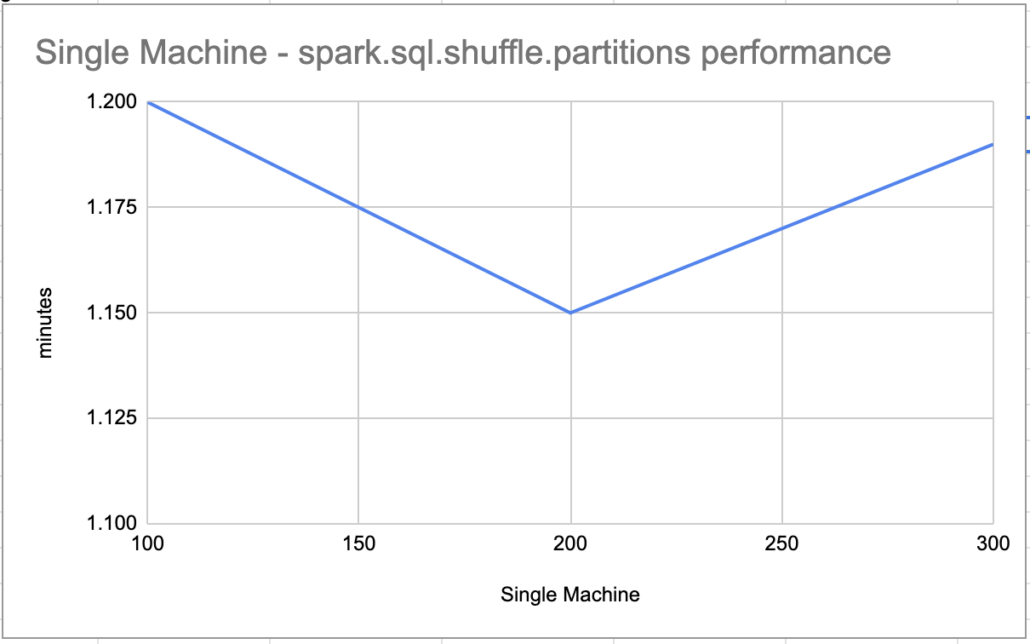
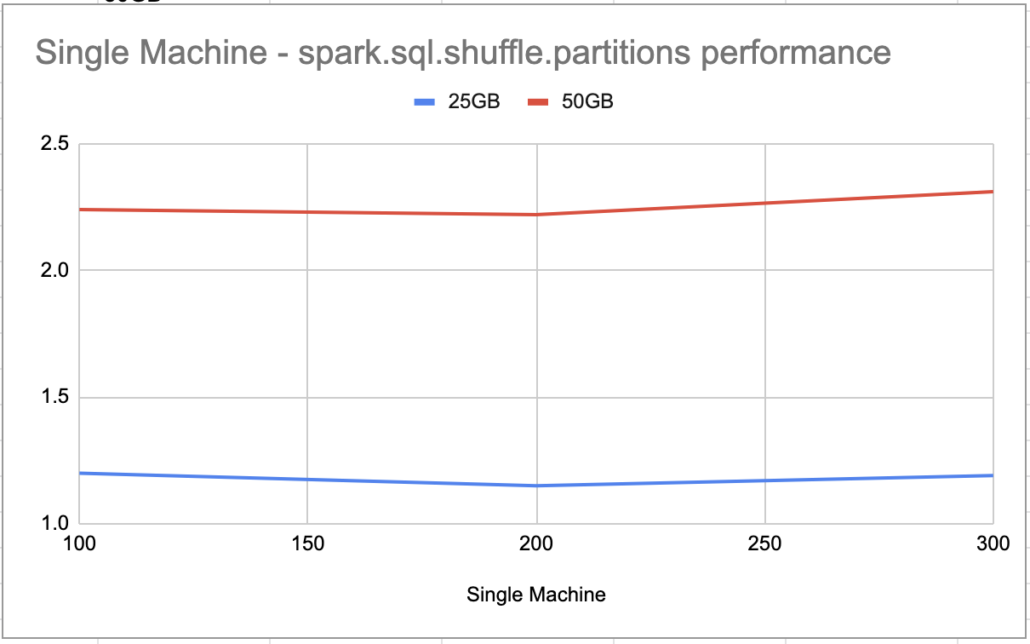
Well I’ll be. Usually the defaults are no good. In this case it appears the default 200 for What about if we go up this time? Set spark.sql.shuffle.partitions seem’s to be the sweet spot for a single machine with 20ish GB of data. I wonder what would happen if I doubled the data?
I downloaded more of the hard drive stats, so I have about 49 GBs. Re-running.
Does doubling the data change single machine performance?
default spark.sql.shuffle.partitions 200 time it took 0:02:22.253674
spark.sql.shuffle.partitions100 time it took 0:02:24.967341
spark.sql.shuffle.partitions 300 time it took 0:02:31.969754
spark.sql.shuffle.partitions250 time it took 0:02:25.925124
spark.sql.shuffle.partitions175 time it took 0:02:27.637932
Pretty much no matter what I did, the default 200 seemed to give the best performance, so no difference between 20 and 50 GBs of data. I’m curious if the data set was 100 TB’s or more, if we would see similar behavior or if changes here would be more pronounced in the performance.
Testing spark.sql.shuffle.partitions on a 3 node Spark cluster.
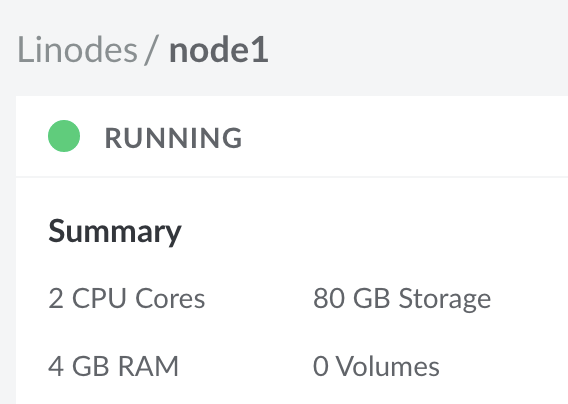
I want to see if anything changes running with a 3 node cluster. Each node has 2CPU and 4GB of RAM.
If you’re curious I used this old blog post of mine with instructions on how to setup my cluster. Below is my Spark cluster setup.
To make my life easy I’m just going to scp all the data out onto each node, so it is available locally instead of through cloud storage.
For example to get all my files out onto my Spark master …. scp -r data root@96.126.120.97:/
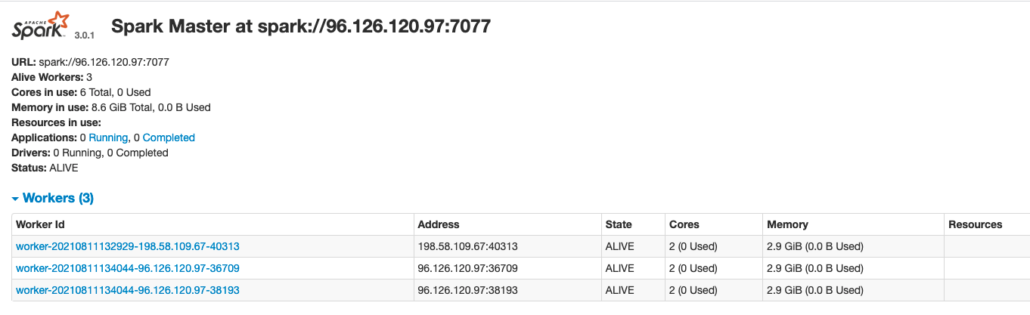
After submitting the application to my cluster we can see it running in the UI below. This is with all 50 GB’s of data.

Below are the times for the 100, 200, and 300 spark.sql.shuffle.partitions runs.
spark.sql.shuffle.partitions 100 time it took 0:05:57.703615
spark.sql.shuffle.partitions 200 time it took 0:05:50.241619
spark.sql.shuffle.partitions 300 time it took 0:05:55.064071
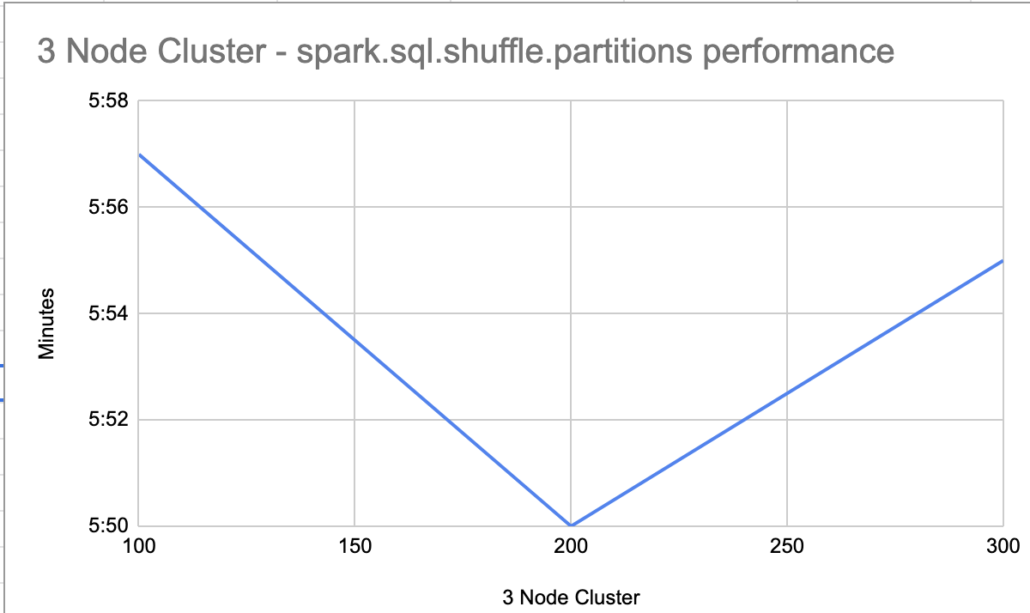
Again with the 3 node Spark cluster, although there is a lot less memory available then the single machine, the same performance characteristics show up.
Barley any speed changes when moving from the default 200 spark.sql.shuffle.partitions to both 100 and 300, both being slower.
I’m starting to think this has more to do with the small data size. I would have thought that tuning the shuffle partitions, no matter what the data size, would have a great affect on performance. I can only guess if we were using 50 TB instead of 50 GB we might see a more pronounced difference in performance, but what do I know.
Musings
Not really sure what I learned after all that. Spark is a big data system, and 50 GB of data really means nothing … my guess is a larger dataset would provide more insight into how tuning configurations like spark.sql.shuffle.partitions can affect performance over big data sets. There is an obvious small change in speeds in the charts above, but nothing to write home about.